
Supplier management becomes much easier when decisions are based on data rather than impressions.
A factory may appear responsive, offer competitive prices, and maintain a strong relationship with the buyer. But those qualities do not necessarily tell you whether the supplier is consistently delivering acceptable products, meeting production schedules, controlling defects, and resolving problems effectively.
Professional importers need supplier metrics.
The challenge is deciding which metrics actually matter.
Tracking dozens of numbers can create reports without improving sourcing decisions. The most useful supplier KPIs are those that reveal changes in quality, delivery, cost, reliability, responsiveness, and operational risk.
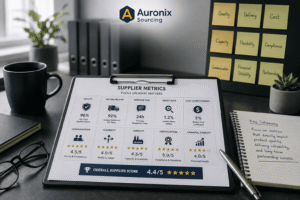
Why Supplier Metrics Matter
Supplier performance can change over time.
A factory that performed extremely well during the first three orders may later experience:
- Higher defect rates
- Longer lead times
- Capacity constraints
- Material problems
- Communication delays
Without historical data, deterioration can be difficult to identify until a major problem occurs.
Supplier metrics create an early-warning system.
1. Defect Rate
Defect rate is one of the most important quality metrics.
A simple calculation is:
Defect Rate = Defective Units ÷ Units Inspected × 100
For example, if 35 defective units are found among 2,000 inspected units:
Defect Rate = 1.75%
The exact interpretation depends on the inspection method and defect classification.
More important than one isolated number is the trend.
If the supplier moves from:
1.0% → 1.4% → 2.3% → 3.1%
quality may be deteriorating.
Separate Defects by Severity
Not every defect has the same business impact.
Depending on the inspection framework, defects may be classified as:
- Critical
- Major
- Minor
A small cosmetic imperfection should not necessarily be treated the same way as a defect affecting product safety or functionality.
Track defect categories separately when appropriate.
2. Inspection Pass Rate
Another useful metric is the percentage of inspections that meet established acceptance criteria.
For example:
Orders inspected: 20
Orders passed: 18
Inspection pass rate:
90%
Repeated inspection failures may indicate weaknesses in:
- Process control
- Worker training
- Material control
- Internal QC
A supplier requiring repeated reinspection creates additional cost and schedule risk even when the goods eventually pass.
3. On-Time Delivery Rate
A supplier can manufacture excellent products and still create major business problems if orders consistently arrive late.
Track whether orders meet the agreed milestone.
For example:
Orders due: 12
Orders completed on time: 10
On-time rate:
83.3%
However, define “on time” clearly.
Are you measuring:
- Production completion?
- Inspection readiness?
- Cargo-ready date?
- Shipment date?
Use one consistent definition.
4. Lead-Time Variance
Average lead time alone can hide instability.
Suppose Supplier A normally delivers in:
28–32 days
while Supplier B delivers in:
20–45 days
Even if their average lead times are similar, Supplier A may be much easier to plan around.
Track:
Promised Lead Time vs. Actual Lead Time
Repeated variance can indicate weak production scheduling or unrealistic sales promises.
5. First-Pass Yield
For suitable manufacturing environments, first-pass yield can reveal how much production meets requirements without rework.
A factory might eventually deliver acceptable goods, but only after significant:
- Repair
- Rework
- Sorting
- Replacement
High dependence on rework can indicate process instability.
Where this data is available and reliable, it can provide deeper insight than final inspection alone.
6. Corrective-Action Effectiveness
When a defect occurs, the supplier’s response matters almost as much as the original problem.
Track whether the supplier:
- Identifies the problem
- Determines root cause
- Implements corrective action
- Prevents recurrence
A supplier that repeatedly produces the same defect is not solving the underlying manufacturing problem.
Record recurring defects across multiple orders.
7. Complaint Rate
Post-delivery customer complaints provide information that factory inspections may not capture.
Products can pass inspection but later develop:
- Durability problems
- Functional failures
- Packaging issues
- Premature wear
Track complaints by:
- Product
- Batch
- Supplier
- Defect type
This helps connect customer experience back to manufacturing performance.
8. Return or Warranty Rate
Where relevant to the product category, returns and warranty claims can provide another important supplier-quality signal.
However, not every return is caused by manufacturing.
Customers may return products because of:
- Wrong size
- Changed preference
- Shipping damage
- Product expectations
Separate manufacturing-related returns from unrelated customer returns before using the data to evaluate a factory.
9. Cost of Poor Quality
Defect percentage alone does not show the financial impact of supplier problems.
Track costs associated with:
- Reinspection
- Rework
- Replacement
- Returns
- Emergency freight
- Disposal
A supplier with a slightly lower unit price can become substantially more expensive if quality failures generate repeated downstream costs.
This is why supplier cost should be evaluated beyond the purchase price.
10. Price Stability
The lowest quotation today does not necessarily mean the lowest long-term cost.
Track how supplier pricing changes over time.
Unexpected increases may result from legitimate factors such as:
- Raw-material changes
- Exchange rates
- Component costs
The important question is whether price adjustments are transparent and commercially reasonable.
A supplier that repeatedly changes pricing without clear explanation can make forecasting difficult.
11. MOQ Flexibility
For businesses managing inventory risk, MOQ can be an important supplier metric.
Track whether the supplier can support:
- Test orders
- Repeat orders
- Multiple variants
- Growth quantities
However, lower MOQ is not automatically better.
Very small orders may increase unit costs or reduce production efficiency.
Evaluate MOQ relative to your inventory strategy.
12. Capacity Reliability
A factory may claim significant monthly capacity.
The more useful question is whether it can consistently reserve enough capacity for your business.
Track:
- Confirmed production slots
- Capacity-related delays
- Peak-season performance
- Ability to scale
This becomes increasingly important as your order volume grows.
13. Communication Response Time
Response time can be useful—but should not be overvalued.
A salesperson replying within two minutes with:
“Yes, no problem.”
is not necessarily communicating better than an engineer returning with a detailed answer several hours later.
Track communication quality alongside speed.
14. Communication Accuracy
A more valuable communication metric is whether the supplier provides accurate information.
Consider:
- Are production updates reliable?
- Are problems disclosed early?
- Are technical questions answered correctly?
- Do promised dates match reality?
A supplier that responds slightly slower but provides accurate information can be easier to manage than one that responds instantly with unreliable answers.
15. Sample-to-Production Consistency
An excellent sample has limited value if mass production does not match it.
Compare production against the approved:
- Sample
- Specification
- Drawings
- Materials
- Packaging
Repeated differences between samples and production should significantly affect supplier performance evaluation.
16. Unauthorized Change Frequency
One particularly important risk metric is how often a supplier changes something without approval.
This might involve:
- Materials
- Components
- Dimensions
- Packaging
- Manufacturing process
Even when the final product appears acceptable, unauthorized substitutions can create serious consistency and compliance risks.
Ideally, this metric should remain at zero.
17. Production Milestone Accuracy
Instead of tracking only the final completion date, measure whether important intermediate milestones are achieved.
For example:
Materials Ready → Production Start → Assembly Complete → Packaging Complete → Inspection Ready
This can reveal delays earlier.
If material readiness is already seven days late, the buyer does not need to wait until the final deadline to recognize schedule risk.
18. Problem Notification Time
How quickly does the supplier tell you when something goes wrong?
This metric is often overlooked.
A strong supplier may report:
“Component delivery will be three days late. Here are two recovery options.”
A weaker supplier may hide the same problem until the buyer asks why production is late.
Early bad news is often more valuable than late reassurance.
19. Rework Frequency
Track how often production requires substantial correction before shipment.
Frequent rework can indicate unstable processes even if final goods eventually pass inspection.
It can also contribute to:
- Delays
- Additional handling
- Inconsistent workmanship
Repeated rework should trigger deeper investigation.
20. Supplier Responsiveness to Improvement
Not every supplier begins perfectly.
What matters is whether performance improves.
If you identify a recurring packaging defect and the supplier reduces it significantly over the next three orders, that demonstrates useful corrective capability.
Supplier metrics should therefore measure trends rather than simply punish isolated problems.
Build a Supplier KPI Dashboard
A practical supplier dashboard does not need dozens of indicators.
For many businesses, a core dashboard could contain:
| Supplier KPI | What It Measures |
|---|---|
| Defect Rate | Product quality |
| Inspection Pass Rate | Quality consistency |
| On-Time Delivery | Schedule reliability |
| Lead-Time Variance | Planning predictability |
| Complaint Rate | Post-delivery performance |
| Corrective-Action Success | Problem solving |
| Cost of Poor Quality | Financial impact |
| Unauthorized Changes | Process discipline |
| Communication Accuracy | Information reliability |
| Capacity Reliability | Ability to support demand |
These metrics provide a much broader picture than price alone.
Track Trends, Not Just Snapshots
One bad order does not automatically make a supplier unreliable.
Likewise, one excellent order does not prove long-term performance.
Look at trends across multiple purchase orders.
For example:
| Order | Defect Rate | On-Time |
|---|---|---|
| PO-01 | 0.9% | Yes |
| PO-02 | 1.2% | Yes |
| PO-03 | 1.8% | No |
| PO-04 | 2.7% | No |
The pattern is more important than any single data point.
Here, both quality and delivery appear to be deteriorating.
That deserves investigation.
Compare Suppliers Using the Same Definitions
Supplier metrics become misleading when definitions differ.
If Factory A’s defect rate is based on final inspection while Factory B’s includes every in-process defect, comparing the percentages directly may be unfair.
Define:
- Measurement method
- Data source
- Reporting period
- Acceptance criteria
Consistency makes supplier benchmarking much more useful.
Do Not Reward Easy-to-Measure Metrics
Businesses sometimes track what is convenient rather than what matters.
For example, response time is easy to measure.
Root-cause effectiveness is harder.
But the second may have much greater impact on manufacturing performance.
Choose metrics because they improve supplier decisions—not because they are easy to place in a spreadsheet.
Combine Metrics Into a Supplier Score
Core KPIs can feed into a weighted supplier-performance score.
For example:
Quality — 35%
Delivery — 25%
Cost — 15%
Communication — 10%
Corrective Action — 10%
Capacity — 5%
The exact weighting should reflect your product and business priorities.
For safety-critical or technically demanding products, quality may deserve even greater emphasis.
Create Performance Thresholds
Metrics become more useful when they trigger action.
For example:
Green: Performing within target.
Yellow: Performance requires monitoring.
Red: Corrective action or supplier review required.
Thresholds should be established based on your actual product and operational requirements rather than arbitrary universal numbers.
Use Metrics During Supplier Negotiations
Historical performance provides useful evidence during commercial discussions.
Instead of saying:
“Your quality has been getting worse.”
you can say:
“Inspection defect levels increased across the last three production batches, and two orders required rework.”
Specific evidence creates a much more productive supplier conversation.
Know When Metrics Indicate It Is Time to Switch
No single KPI should automatically trigger supplier replacement in every situation.
However, persistent deterioration across several important indicators can be significant.
Warning patterns may include:
Defect Rate ↑
Late Deliveries ↑
Unauthorized Changes ↑
Corrective-Action Effectiveness ↓
Communication Accuracy ↓
At that point, developing or activating a backup supplier may be appropriate.
How Auronix Sourcing Helps Track Supplier Performance
Auronix Sourcing helps businesses evaluate Chinese manufacturers using operational data rather than relying solely on quotations and supplier promises.
Support can include supplier verification, factory audits and visits, sample management, production monitoring, quality inspection, defect tracking, corrective-action follow-up, production milestone monitoring, supplier-performance evaluation, backup supplier development, packaging coordination, shipment consolidation, and international shipping coordination.
By monitoring quality, delivery, communication, and production performance across multiple orders, Auronix helps businesses identify supplier problems earlier and make more informed sourcing decisions.
Conclusion
The best supplier metrics are not the ones that create the largest dashboard.
They are the ones that help answer important business questions:
Is quality improving or deteriorating?
Does the supplier deliver when promised?
Are problems being solved permanently?
Is the supplier’s low price creating hidden costs elsewhere?
Can the factory support future growth?
For most importers, the strongest supplier management system focuses on a small group of meaningful indicators covering:
Quality + Delivery + Cost + Capacity + Communication + Corrective Action
Track those metrics consistently across orders, review the trends, and connect poor performance to specific corrective actions.
With Auronix Sourcing, businesses can verify manufacturers, monitor production, inspect quality, track supplier performance, manage corrective actions, and develop backup suppliers—turning supplier management from a relationship based mainly on impressions into a process supported by measurable evidence