
A single quality inspection tells you whether one production batch meets your requirements.
It does not tell you whether your supplier’s quality is improving or deteriorating.
That requires tracking defect data across multiple orders.
For importers, ecommerce brands, and private-label businesses, historical defect tracking is one of the most useful ways to understand supplier performance. It can reveal recurring manufacturing problems, identify unstable production processes, measure whether corrective actions actually work, and provide evidence when deciding whether to continue working with a factory.
The objective is not simply to record how many defective units were found.
A useful defect-tracking system answers a more important question:
What is happening to product quality over time—and why?
Start With a Consistent Definition of a Defect
Before comparing orders, establish what counts as a defect.
Depending on the product, defects might include:
- Incorrect dimensions
- Cosmetic damage
- Functional failure
- Wrong components
- Poor assembly
- Color variation
- Printing problems
- Packaging defects
If the definition changes between inspections, historical comparisons become unreliable.
The same quality standards should be applied consistently wherever practical.
Separate Critical, Major, and Minor Defects
Not every defect represents the same level of risk.
Quality-control systems commonly distinguish between different defect severity levels.
Depending on the product and inspection framework, these may include:
Critical Defects — Problems that could create serious safety, regulatory, or usability concerns.
Major Defects — Problems likely to affect normal product use, saleability, or customer acceptance.
Minor Defects — Smaller deviations that do not significantly affect normal product function.
The exact classification should be established for the specific product.
Create a Defect Classification List
Do not allow inspectors to describe the same defect differently on every order.
For example:
Order 1: Surface scratch
Order 2: Cosmetic mark
Order 3: Scratched housing
These could all represent the same underlying defect.
Create standardized defect codes such as:
D01 — Surface scratch
D02 — Color mismatch
D03 — Loose component
D04 — Incorrect logo position
D05 — Functional failure
Standardized categories make trend analysis much easier.
Record Data by Purchase Order
Every inspection record should be connected to the relevant production batch.
At minimum, record:
- Purchase order number
- Supplier
- Product SKU
- Production date
- Order quantity
- Inspection quantity
- Number of defects
- Defect classification
- Inspection result
This allows problems to be traced back to a specific manufacturing event.
Calculate the Observed Defect Rate
A simple defect rate can be calculated as:
Defect Rate = Defective Units ÷ Units Inspected × 100
For example:
If 40 defective units are identified among 2,000 inspected units:
40 ÷ 2,000 × 100 = 2%
This gives you an observed defect percentage for that inspection.
However, the calculation should be interpreted in the context of the inspection sampling method and acceptance criteria.
Do Not Confuse Defects With Defective Units
This distinction matters.
One product may contain multiple defects.
For example, one unit could have:
- A scratch
- Incorrect printing
- Loose assembly
That represents:
1 defective unit
but:
3 defects
Depending on your quality-management objective, track both.
This gives a clearer picture of production quality.
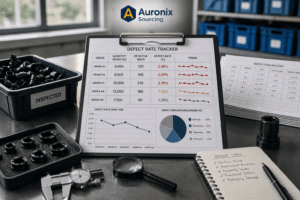
Build a Defect Tracking Table
A simple historical record might look like this:
| Order | Units Inspected | Defective Units | Observed Rate |
|---|---|---|---|
| PO-101 | 1,000 | 12 | 1.2% |
| PO-102 | 1,200 | 18 | 1.5% |
| PO-103 | 1,500 | 33 | 2.2% |
| PO-104 | 1,400 | 42 | 3.0% |
Looking at PO-104 alone tells you the observed defect rate was 3%.
Looking at all four orders reveals something much more important:
Quality appears to be deteriorating.
That trend deserves investigation.
Track Defect Types Separately
The overall defect percentage does not always explain the underlying problem.
Suppose the total defect rate increased because one specific issue suddenly appeared.
Create another table:
| Defect Type | PO-101 | PO-102 | PO-103 | PO-104 |
|---|---|---|---|---|
| Scratches | 4 | 6 | 15 | 27 |
| Color Issues | 3 | 4 | 5 | 4 |
| Assembly | 5 | 8 | 13 | 11 |
Now the primary problem becomes visible.
Surface scratches are increasing much faster than other defect categories.
The supplier can investigate that specific process.
Look for Patterns, Not Isolated Numbers
One poor inspection does not automatically mean the supplier has become unreliable.
A temporary issue could have been caused by:
- One material batch
- Machine malfunction
- New worker training
- Packaging handling
The more important question is whether the problem continues.
For example:
1.0% → 1.1% → 1.0% → 2.8% → 1.1%
may represent one abnormal batch.
But:
1.0% → 1.4% → 1.9% → 2.5% → 3.1%
suggests a deteriorating process.
Trend direction matters.
Compare Similar Products Properly
Do not combine unrelated products into one defect percentage without understanding the differences.
A simple plastic accessory and a complex electronic product have very different manufacturing risks.
Where possible, track defects by:
Supplier → Product → SKU → Purchase Order
You can then create supplier-level summaries separately.
This prevents one difficult product from unfairly distorting the supplier’s overall performance.
Track Production Lines Where Possible
Large factories may manufacture the same product across different:
- Production lines
- Workshops
- Shifts
If defect rates suddenly change, identifying the production line can help isolate the cause.
For example:
Line A defect rate: 1.1%
Line B defect rate: 3.8%
Now the supplier knows where to investigate first.
Record Material and Component Batches
For higher-risk products, defects may originate upstream.
Track important:
- Material batches
- Component suppliers
- Component lots
Suppose functional failures increase only when one particular component batch is used.
That information can dramatically accelerate root-cause analysis.
Track Inspection Stage
Defects discovered during production may provide different information from defects discovered after packaging.
Separate:
- Incoming material inspection
- In-process inspection
- Pre-shipment inspection
This helps determine where the problem enters the manufacturing process.
Connect Customer Complaints to Production Orders
Factory inspection is only one source of quality information.
Some problems appear after customers begin using the product.
Where possible, connect customer complaints to:
- SKU
- Production batch
- Purchase order
- Supplier
This is especially valuable for problems involving:
- Durability
- Long-term functionality
- Premature component failure
A batch may pass visual inspection and still create poor customer outcomes later.
Track Manufacturing-Related Returns
Returns can provide additional information, but they need to be categorized correctly.
Separate returns caused by:
Manufacturing Defects
from returns caused by:
- Customer preference
- Incorrect size selection
- Shipping damage
- Other non-manufacturing reasons
Otherwise, supplier quality may appear worse than it actually is.
Investigate Sudden Defect Increases
When a significant increase appears, do not simply tell the supplier:
“Quality is getting worse.”
Investigate what changed.
Ask whether there were changes involving:
- Raw materials
- Component suppliers
- Production workers
- Machines
- Tooling
- Production speed
- Subcontractors
- Packaging
A sudden change in defect rate often has an operational explanation.
Use Root-Cause Analysis
The objective of quality management is not simply to identify defective products.
It is to prevent the same defects from returning.
A useful process is:
Defect Identified → Root Cause Investigated → Corrective Action Implemented → Next Production Verified
If the same defect appears repeatedly, the corrective action may not have addressed the true cause.
Measure Corrective-Action Effectiveness
Suppose scratches represent the largest defect category.
The factory identifies poor handling between assembly and packaging as the root cause and introduces protective trays.
Now compare the next orders.
Before corrective action:
Scratch defect rate: 2.4%
After corrective action:
Scratch defect rate: 0.6%
This provides evidence that the corrective action worked.
Without historical tracking, that improvement would be difficult to quantify.
Watch for Defect Migration
Sometimes one problem disappears while another appears.
For example:
Scratches ↓
but:
Assembly damage ↑
This can happen when a process change solves one problem but introduces another.
That is why buyers should track both total defect levels and individual defect categories.
Use Rolling Performance Data
As order history grows, evaluate performance across a recent group of orders rather than relying entirely on lifetime averages.
A supplier may have performed extremely well for three years but deteriorated during the last six months.
A lifetime average can hide the recent decline.
Reviewing the:
Last 3 Orders
or:
Last 6 Orders
can provide a clearer picture of current performance.
Avoid Comparing Unequal Inspection Data
Suppose:
Order A: 1,000 units inspected
Order B: 100 units inspected
Raw defect counts cannot be compared directly.
Use consistent rates and understand the sampling methodology.
Similarly, inspection plans and acceptance criteria should remain comparable when analyzing trends.
Build a Supplier Quality Dashboard
A useful dashboard might include:
| KPI | Current | Previous | Trend |
|---|---|---|---|
| Observed Defect Rate | 2.1% | 1.6% | ↑ |
| Critical Defects | 0 | 0 | Stable |
| Major Defects | 18 | 12 | ↑ |
| Minor Defects | 26 | 24 | ↑ |
| Repeat Defects | 3 | 1 | ↑ |
| Inspection Result | Pass | Pass | Stable |
The purpose is not to create a complicated report.
It is to make changes visible quickly.
Establish Internal Alert Levels
Businesses can define internal thresholds that trigger additional review.
For example:
Green: Performance within expected range.
Yellow: Negative trend requiring investigation.
Red: Significant quality deterioration requiring corrective action.
Thresholds should reflect the specific product, quality requirements, inspection method, and commercial risk.
There is no single universal defect percentage appropriate for every product.
Use Defect Data in Supplier Reviews
When discussing quality with the factory, present evidence.
Instead of:
“Your quality is bad.”
show:
PO-101: 1.2%
PO-102: 1.5%
PO-103: 2.2%
PO-104: 3.0%
Then identify the largest defect categories.
Data turns an emotional quality dispute into a measurable manufacturing discussion.
Compare Suppliers Using Equivalent Data
If multiple factories manufacture comparable products, historical defect data can support supplier allocation decisions.
For example:
| Metric | Supplier A | Supplier B |
|---|---|---|
| Avg. Observed Defect Rate | 1.3% | 2.4% |
| Repeat Defect Types | 1 | 4 |
| Reinspection Frequency | Low | High |
| Corrective Action | Strong | Weak |
Supplier A may justify receiving more production volume even if its unit price is slightly higher.
Calculate the Financial Impact
Defect rates should ultimately connect to business impact.
Quality problems can create costs involving:
- Reinspection
- Sorting
- Rework
- Replacement
- Returns
- Refunds
- Emergency freight
Tracking these costs alongside defect percentages reveals the cost of poor quality.
This can completely change how two suppliers compare.
Do Not Chase Zero Defects Without Context
The appropriate quality target depends on the product, manufacturing process, risk, and acceptance requirements.
Unrealistically demanding perfect cosmetic consistency on a low-cost product may increase production costs substantially.
Conversely, certain critical defects may require effectively zero tolerance.
Quality targets should therefore be commercially and technically appropriate.
Use the Data to Decide When to Escalate
A supplier should receive additional attention when historical data shows patterns such as:
Defect Rate ↑
Repeat Defects ↑
Inspection Failures ↑
Customer Complaints ↑
Corrective-Action Effectiveness ↓
If these trends continue despite corrective actions, activating a backup supplier may become appropriate.
Keep Historical Quality Records
Do not delete inspection information after an order ships.
Maintain records of:
- Inspection reports
- Defect photographs
- Corrective actions
- Reinspection results
- Customer complaints
- Supplier responses
Historical quality records become increasingly valuable as purchasing volume grows.
They can reveal patterns that would otherwise remain invisible.
How Auronix Sourcing Helps Track Supplier Quality
Auronix Sourcing helps businesses monitor manufacturing quality across repeated orders from Chinese suppliers.
Support can include supplier verification, factory audits and visits, pre-production checks, during-production monitoring, pre-shipment quality inspection, defect classification, production-batch tracking, corrective-action follow-up, supplier-performance evaluation, packaging verification, backup supplier development, shipment consolidation, and international shipping coordination.
By comparing quality data across multiple purchase orders rather than evaluating each shipment in isolation, Auronix helps businesses identify recurring defects, monitor corrective actions, and recognize supplier-quality deterioration earlier.
Conclusion
Tracking defect rates across multiple orders transforms quality inspection from a one-time checkpoint into a long-term supplier intelligence system.
The process should be:
Define Defects → Standardize Categories → Record Each Order → Calculate Rates → Compare Trends → Identify Root Causes → Implement Corrective Actions → Verify Improvement
Do not focus only on the total percentage.
Track which defects occur, where they occur, whether they repeat, what causes them, and whether corrective actions actually reduce them.
One defective batch tells you that something went wrong.
A structured history across ten or twenty orders can tell you whether the supplier’s manufacturing process is becoming stronger or weaker.
With Auronix Sourcing, businesses can monitor production, inspect quality, track defects across orders, manage corrective actions, evaluate supplier performance, and develop backup manufacturers—helping turn quality data into better long-term sourcing decisions.