
Managing suppliers becomes increasingly difficult as an importing business grows.
With one supplier and a few purchase orders, it may be possible to remember which factory delivers on time, which product had quality problems, and which supplier communicates well. Once the business manages dozens of SKUs, multiple factories, repeated inspections, and larger purchasing volumes, memory is no longer enough.
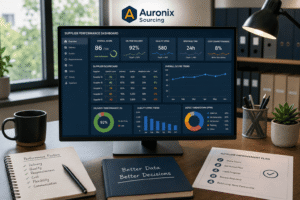
A supplier performance dashboard turns sourcing data into a structured management tool.
Instead of asking:
“How is this supplier doing?”
the dashboard should answer:
“Is quality improving? Are deliveries becoming less reliable? What problems are repeating? Which supplier creates the highest hidden costs? Where should we take action?”
A useful dashboard does not need hundreds of metrics. It needs the right data, measured consistently over time.
What Is a Supplier Performance Dashboard?
A supplier performance dashboard is a centralized view of the key metrics used to evaluate manufacturers across multiple orders.
Depending on the business, it may track:
- Quality
- Delivery
- Cost
- Lead time
- Corrective actions
- Communication
- Capacity
- Customer complaints
The dashboard can be created in a spreadsheet, business intelligence platform, ERP system, or dedicated supplier-management software.
The technology matters less than the quality and consistency of the underlying data.
Start With the Decisions the Dashboard Must Support
Do not begin by adding every metric you can find.
Start by identifying the decisions you need to make.
For example:
- Should this supplier receive more orders?
- Is quality deteriorating?
- Should we renegotiate pricing?
- Do we need a backup supplier?
- Are corrective actions working?
- Which factory is most reliable?
Every KPI should help answer a real sourcing question.
If a metric never influences a decision, reconsider whether it belongs on the dashboard.
Create a Supplier Master Record
Each supplier should have a unique identifier.
The master record might contain:
| Field | Example |
|---|---|
| Supplier ID | SUP-014 |
| Supplier Name | Factory A |
| Product Category | Home Accessories |
| Location | Guangdong |
| Main Contact | Sales Manager |
| Status | Approved |
| Risk Level | Medium |
This becomes the foundation for connecting purchase orders, inspections, defects, and commercial information.
Connect Every Purchase Order
Performance data should be traceable to individual orders.
Record relevant information such as:
- PO number
- Supplier
- SKU
- Order quantity
- Order value
- Order date
- Promised completion date
- Actual completion date
- Inspection result
This allows dashboard-level metrics to be traced back to the original transaction.
KPI 1: Defect Rate
Quality should usually be one of the most visible dashboard sections.
A basic observed defect rate can be calculated as:
Defective Units ÷ Units Inspected × 100
For example:
25 defective units ÷ 2,000 inspected units × 100 = 1.25%
Track this consistently across orders.
The trend is usually more informative than a single inspection result.
Separate Defect Severity
Where appropriate, divide defects into categories such as:
- Critical
- Major
- Minor
This prevents a large number of minor cosmetic issues from appearing equivalent to a small number of potentially serious functional or safety-related defects.
The definitions should match your product and inspection methodology.
Track Repeat Defects
A particularly valuable dashboard indicator is the number of defects that return after corrective action.
For example:
PO-01: Scratching identified
PO-02: Scratching repeated
PO-03: Scratching repeated again
The issue is no longer simply a defect.
It is evidence that the supplier’s corrective-action process may not be working.
Repeat defects should be highly visible.
KPI 2: Inspection Pass Rate
Track how frequently orders pass agreed inspection criteria.
For example:
Inspections conducted: 20
Inspections passed: 18
Pass rate: 90%
A declining inspection pass rate can indicate deteriorating process control.
You may also track how many orders required:
- Rework
- Reinspection
- Sorting
These activities create additional cost and schedule risk.
KPI 3: On-Time Delivery
Delivery performance should have a precise definition.
Choose a milestone such as:
Cargo-ready date
Then calculate how many orders met the agreed date.
For example:
Orders: 25
On time: 22
On-time performance: 88%
Do not change the milestone definition between suppliers or reporting periods.
Track Delay Severity
On-time percentage does not show how serious delays are.
Add:
- Average days late
- Maximum days late
A supplier that occasionally misses deadlines by one day presents a different risk from a factory regularly missing them by two weeks.
KPI 4: Lead-Time Variance
Compare:
Promised Lead Time vs. Actual Lead Time
Suppose the factory promises 30 days.
Historical performance shows:
31 → 32 → 36 → 41 → 44 days
The dashboard should make that trend visible.
A gradually increasing lead time may reveal capacity or material-management problems before the supplier openly acknowledges them.
KPI 5: Cost Performance
Track historical unit pricing by:
- Supplier
- SKU
- Quantity
This helps identify pricing trends.
However, do not compare unit prices without considering specification and order quantity.
A price increase may be legitimate if materials, components, packaging, or volume changed.
Track the Cost of Poor Quality
Unit price alone can be misleading.
Include costs caused by supplier performance, such as:
- Reinspection
- Rework
- Replacement
- Sorting
- Returns
- Emergency freight
You can then compare:
Purchase Cost vs. Total Supplier-Related Cost
This may reveal that the cheapest supplier is not actually the lowest-cost supplier.
KPI 6: Corrective-Action Performance
When a supplier problem occurs, track whether the factory successfully eliminates the root cause.
A useful status system might be:
Open → Investigation → Corrective Action Implemented → Verification → Closed
Also record whether the same problem appears again.
This prevents corrective-action reports from becoming paperwork that nobody verifies.
KPI 7: Communication Performance
Communication is partly qualitative, but it can still be evaluated systematically.
Useful criteria include:
- Technical accuracy
- Production-update reliability
- Problem transparency
- Escalation effectiveness
Avoid placing excessive importance on raw response time.
A fast but inaccurate supplier is not necessarily easier to manage.
KPI 8: Capacity Reliability
As purchasing volume increases, capacity becomes more important.
Monitor:
- Production slots confirmed
- Capacity-related delays
- Peak-season performance
- Ability to scale
A factory that performs well at 5,000 units may struggle when orders reach 50,000.
The dashboard should help identify when your growth is beginning to exceed supplier capability.
KPI 9: Unauthorized Changes
Track any supplier change made without required buyer approval.
Examples include:
- Material substitution
- Component substitution
- Dimension changes
- Packaging changes
- Process changes
This metric should ideally remain at zero.
Repeated unauthorized changes can represent a serious supplier-control problem.
KPI 10: Customer Quality Feedback
Where possible, connect post-sale information back to production batches.
Track relevant:
- Customer complaints
- Manufacturing-related returns
- Warranty claims
Link them to:
SKU → PO → Supplier
This allows the dashboard to connect factory performance with real customer experience.
Build an Executive Summary
Senior management should not need to examine hundreds of rows.
The dashboard’s top section can summarize:
| KPI | Current | Previous | Trend |
|---|---|---|---|
| Defect Rate | 2.1% | 1.6% | ↑ |
| Inspection Pass Rate | 92% | 95% | ↓ |
| On-Time Delivery | 89% | 94% | ↓ |
| Average Delay | 4.2 days | 2.8 days | ↑ |
| Repeat Defects | 3 | 1 | ↑ |
The objective is immediate visibility.
A manager should be able to identify deteriorating supplier performance quickly.
Use Trend Charts
Trend charts are particularly valuable for:
- Defect rates
- On-time delivery
- Lead times
- Supplier costs
A single value tells you where performance is today.
A trend tells you where it is heading.
That distinction is critical.
Create Supplier Scorecards
Individual KPIs can be combined into an overall supplier score.
For example:
| Category | Weight |
|---|---|
| Quality | 35% |
| Delivery | 25% |
| Cost | 15% |
| Communication | 10% |
| Corrective Action | 10% |
| Capacity | 5% |
| Total | 100% |
Weights should reflect the product and business model.
A technically demanding product may require greater emphasis on quality.
Add Performance Status Levels
A dashboard becomes more actionable when performance levels trigger management responses.
For example:
Green — Acceptable
Continue normal supplier management.
Yellow — Monitor
Negative trend requires investigation.
Orange — Corrective Action
Supplier improvement plan required.
Red — Supplier Review
Consider reducing exposure or activating alternatives.
The exact thresholds should be customized to your business.
Show Supplier Rankings Carefully
A dashboard can rank suppliers by overall performance.
For example:
| Supplier | Score | Status |
|---|---|---|
| Factory A | 92 | Green |
| Factory B | 84 | Green |
| Factory C | 73 | Yellow |
| Factory D | 61 | Orange |
Rankings can help guide purchasing decisions.
However, suppliers manufacturing very different products should not always be compared directly.
A complex electronics manufacturer faces different quality challenges from a simple packaging supplier.
Filter by Product and Time Period
A useful dashboard should allow analysis by:
- Supplier
- SKU
- Product category
- Purchase order
- Month
- Quarter
- Year
This makes it possible to answer different questions.
For example:
“Which supplier had the highest defect rate this quarter?”
or:
“How has Factory B performed on Product X over the last six orders?”
Use Rolling Performance Windows
Lifetime averages can hide recent deterioration.
Suppose a supplier performed perfectly for three years but struggled during the last four orders.
Its lifetime score may still look excellent.
Include recent views such as:
- Last 3 orders
- Last 6 orders
- Last 12 months
This provides a clearer picture of current supplier health.
Make Data Traceable
Every dashboard number should connect back to evidence.
If the dashboard shows:
Defect Rate: 3.4%
the sourcing team should be able to identify:
- Which order
- Which inspection
- Which defects
- Which report
Traceability prevents disputes and improves corrective-action discussions.
Assign Responsibility for Data Entry
A dashboard fails quickly when nobody owns the data.
Define who records:
- Purchase-order information
- Inspection results
- Delivery dates
- Supplier costs
- Corrective actions
- Customer complaints
Also define when information must be updated.
Consistent data entry is more important than sophisticated visualization.
Keep Definitions Consistent
If “on-time delivery” means cargo-ready date this month and shipment date next month, the dashboard becomes unreliable.
Create a KPI dictionary defining:
Metric → Formula → Data Source → Reporting Frequency → Owner
This keeps reporting consistent as the team grows.
Automate Where Practical
As order volume increases, manual dashboard maintenance can become inefficient.
Data may eventually be connected from:
- ERP systems
- Purchase-order records
- Inspection databases
- Logistics records
Automation can reduce data-entry errors.
However, automating bad data simply produces bad reports faster.
Standardize the process first.
Review the Dashboard Regularly
A dashboard has little value if nobody uses it.
Review important suppliers on an appropriate schedule.
For example:
After Each Order: Record operational performance.
Monthly: Review major issues.
Quarterly: Analyze supplier trends.
Annually: Conduct strategic supplier review.
The frequency should reflect purchasing volume and supplier risk.
Use Dashboard Data During Negotiations
Supplier negotiations become much stronger when supported by evidence.
Instead of saying:
“Your quality is getting worse.”
show:
Defect Rate: 1.2% → 1.7% → 2.4%
Instead of:
“You are always late.”
show:
On-Time Delivery: 95% → 87% → 78%
This creates a factual commercial conversation.
Use the Dashboard to Allocate Orders
Performance data can influence purchasing allocation.
Strong suppliers may receive:
- More volume
- More strategic products
- Longer-term opportunities
Weak suppliers may receive reduced orders until performance improves.
This connects supplier performance with commercial consequences.
Use It to Identify When a Backup Supplier Is Needed
A supplier dashboard should function as an early-warning system.
If several indicators begin moving negatively:
Defects ↑
Delivery Reliability ↓
Lead Time ↑
Repeat Problems ↑
Corrective-Action Success ↓
the business can begin qualifying alternatives before a major failure occurs.
This is far safer than searching for a new factory during an emergency.
How Auronix Sourcing Supports Supplier Performance Management
Auronix Sourcing helps businesses collect and evaluate supplier-performance information throughout repeated orders from Chinese manufacturers.
Support can include supplier verification, factory audits and visits, production milestone monitoring, quality inspection, defect tracking, corrective-action follow-up, quotation comparison, production-capacity assessment, supplier-performance evaluation, packaging verification, backup supplier development, shipment consolidation, and international shipping coordination.
By connecting supplier verification with ongoing production and quality data, Auronix helps businesses evaluate factories based on measurable long-term performance rather than quotations and impressions alone.
Conclusion
A supplier performance dashboard should do more than display attractive charts.
It should help businesses answer:
Who is performing well?
Who is deteriorating?
Where are the biggest quality and delivery risks?
Which supplier is creating hidden costs?
Where should we take corrective action?
A practical dashboard focuses on:
Quality + Delivery + Cost + Corrective Action + Communication + Capacity
Then it converts those metrics into trends, supplier scores, alerts, and management decisions.
The most important principle is consistency.
Measure the same KPIs using the same definitions across every relevant order.
Over time, the dashboard becomes more than a reporting tool. It becomes a historical record of which factories actually deliver reliable manufacturing performance.
With Auronix Sourcing, businesses can verify suppliers, monitor production, inspect quality, track defects, evaluate performance, manage corrective actions, and develop backup factories—helping transform supplier data into better sourcing decisions.