
Many sourcing problems look small when viewed individually.
A factory ships five days late. A quality inspection requires rework. Packaging dimensions increase freight costs. A supplier raises the unit price by a few cents. A batch generates more customer returns than expected.
Individually, none of these issues may appear serious.
Across dozens of purchase orders, however, the financial impact can become substantial.
This is why professional sourcing management should go beyond tracking supplier prices. Businesses need data that shows where money is actually being lost throughout the sourcing process.
When purchasing, quality, production, logistics, and customer data are connected, businesses can identify their most expensive sourcing problems and prioritize improvements based on financial impact rather than assumptions.
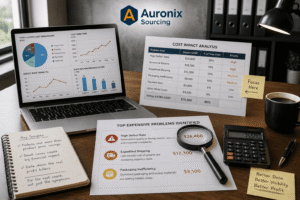
The Cheapest Supplier May Not Create the Lowest Cost
One of the biggest mistakes in sourcing is treating unit price as the primary measure of supplier cost.
Consider two factories:
Supplier A: $4.50 per unit
Supplier B: $4.70 per unit
Supplier A initially appears cheaper.
But Supplier A also generates:
- More defects
- Additional inspections
- Rework
- Production delays
- Emergency air freight
- Customer returns
After those costs are included, Supplier B may actually be the more profitable supplier.
The correct question is not:
“Which factory has the lowest quotation?”
It is:
“Which supplier creates the lowest total cost while meeting our requirements?”
Start by Connecting Your Sourcing Data
Useful sourcing information often exists in separate places.
Purchasing has:
- Purchase orders
- Supplier quotations
- Payment records
Quality teams have:
- Inspection reports
- Defect records
- Corrective actions
Logistics teams have:
- Freight costs
- Shipment dates
- Storage charges
Customer-service teams may have:
- Complaints
- Returns
- Warranty claims
Individually, each dataset tells only part of the story.
Connecting them by supplier, SKU, purchase order, and production batch makes deeper analysis possible.
Track the True Cost of Quality Problems
Defects create costs beyond the defective product itself.
A quality problem may generate:
Defect → Sorting → Rework → Reinspection → Production Delay → Late Shipment
The business may then incur additional expenses involving:
- Inspection fees
- Labor
- Replacement products
- Freight
- Refunds
- Customer support
Without tracking these costs, management may underestimate how expensive poor quality really is.
Calculate Cost of Poor Quality
Create a separate category for costs generated by quality failures.
Depending on your operation, include:
- Reinspection costs
- Sorting costs
- Rework
- Replacement production
- Manufacturing-related returns
- Disposal
- Emergency logistics
Suppose a supplier saves your business $6,000 annually through lower product prices but creates $14,000 in quality-related expenses.
The apparent saving is actually producing an $8,000 net disadvantage before other impacts are considered.
Identify Your Most Expensive Defects
Not every defect deserves equal management attention.
Suppose your annual defect data shows:
| Defect | Frequency | Estimated Cost |
|---|---|---|
| Small cosmetic marks | 1,200 | $2,400 |
| Broken component | 250 | $7,500 |
| Packaging failure | 180 | $11,000 |
| Incorrect labeling | 90 | $15,000 |
Cosmetic marks occur most frequently.
But incorrect labeling creates the greatest financial impact.
If management focuses only on defect frequency, it may spend resources solving the wrong problem.
Track:
Frequency + Cost + Severity
Use Pareto Thinking
A relatively small number of sourcing problems often account for a large portion of avoidable cost.
Rank issues from highest to lowest financial impact.
For example:
- Emergency freight — $32,000
- Packaging failures — $18,000
- Rework — $14,000
- Customer replacements — $9,000
- Reinspection — $5,000
Now management knows where improvement efforts are likely to produce the greatest financial return.
Track Emergency Freight
Emergency air freight is often treated as a logistics expense.
But the root cause may actually be a sourcing problem.
For example:
Supplier Delay → Missed Ocean Shipment → Inventory Risk → Air Freight
If this happens repeatedly, freight data may reveal a supplier production-planning problem.
Record why expedited shipping was required.
Useful root-cause categories might include:
- Supplier delay
- Quality rework
- Late buyer approval
- Forecasting error
- Material shortage
Without root-cause coding, the business may incorrectly blame the logistics department for costs created elsewhere.
Measure the Cost of Supplier Delays
Late production can create financial consequences even when there is no penalty on the purchase order.
Potential impacts include:
- Stockouts
- Expedited shipping
- Lost promotional opportunities
- Additional warehousing coordination
Track:
Promised Date → Actual Date → Days Late → Financial Consequence
Over several orders, you may discover that one factory’s delays are substantially more expensive than its lower quotation saves.
Analyze Lead-Time Variance
Average lead time does not tell the complete story.
Supplier A may consistently complete production in 31–33 days.
Supplier B may range from 22 to 48 days.
Their average lead times could appear similar, but Supplier B creates much greater planning uncertainty.
Measure the difference between:
Promised Lead Time vs. Actual Lead Time
High variability can increase the amount of safety stock the business needs to maintain.
Measure Inventory Created by High MOQs
MOQ is another sourcing cost that is often underestimated.
A factory may offer an attractive unit price only if the buyer purchases 20,000 units.
If realistic demand is 5,000 units, the remaining inventory ties up capital.
Track:
- MOQ
- Actual demand
- Inventory turnover
- Unsold stock
- Storage costs
A higher unit price with a lower MOQ may sometimes produce better overall economics.
Identify Slow-Moving Supplier Inventory
Connect purchasing data with inventory performance.
Ask:
Which supplier orders create the most slow-moving inventory?
If certain suppliers require large MOQs across many colors or variations, they may indirectly increase:
- Inventory holding
- Discounting
- Obsolescence
This is especially important for ecommerce, seasonal, and trend-driven products.
Analyze Packaging Costs
Packaging affects much more than appearance.
Poor packaging decisions can increase:
- Product damage
- Carton volume
- Freight
- Warehousing
Track packaging dimensions and shipment volume.
A small reduction in carton dimensions multiplied across thousands of units may create meaningful logistics savings.
Packaging optimization should therefore be treated as a sourcing decision, not only a branding decision.
Track Damage by Packaging Type
Suppose two packaging configurations produce different damage rates.
Packaging A: Lower cost, higher damage.
Packaging B: Slightly higher cost, substantially lower damage.
The cheapest packaging is not necessarily the most economical.
Compare:
Packaging Cost + Damage Cost + Freight Impact
This reveals the true packaging decision.
Track Supplier Price Changes
Maintain historical pricing by:
Supplier → SKU → Quantity → Date
This helps distinguish market-driven price increases from supplier-specific changes.
For example, if one factory increases pricing by 12% while comparable qualified factories remain relatively stable, the buyer has a reason to investigate.
Historical data also strengthens future negotiations.
Normalize Quotations Before Comparing Them
Price data is useful only when suppliers are quoting comparable requirements.
Factory A may appear cheaper because it quoted:
- Lower-grade material
- Simpler packaging
- Different components
- Different Incoterms
Standardize specifications before comparing quotations.
Otherwise, your database may reinforce a false conclusion.
Track Tooling and Development Costs
Custom products can accumulate significant development expenses.
Record:
- Mold costs
- Prototype costs
- Sample revisions
- Engineering charges
- Printing setup
Then compare these costs with successful production output.
A product requiring repeated redesign and tooling modification may be consuming far more development capital than management realizes.
Measure Sample Revision Frequency
A supplier requiring six sample rounds before approval creates more cost than one achieving approval in two.
Track:
Sample 1 → Revision → Sample 2 → Revision → Approval
Frequent revisions may indicate:
- Poor specification understanding
- Weak engineering capability
- Communication problems
This metric can help evaluate suppliers before mass production begins.
Connect Customer Complaints to Suppliers
Some of your most expensive sourcing problems may only become visible after the product reaches customers.
Link relevant complaints to:
Customer Issue → SKU → Batch → PO → Supplier
Now you can identify whether certain factories or production batches generate disproportionate problems.
This is particularly valuable for durability and long-term functional defects that may not appear during pre-shipment inspection.
Track Manufacturing-Related Returns
Do not automatically blame suppliers for every return.
Separate returns caused by:
- Manufacturing defects
from those caused by:
- Customer preference
- Wrong size
- Shipping damage
- Other reasons
Then calculate the financial impact of manufacturing-related returns by supplier and product.
Measure Repeat Problems
A problem that happens once may be expensive.
A problem that keeps returning after corrective action can be much more serious.
Track:
Problem → Corrective Action → Next Order → Recurrence
Repeated issues indicate that the factory may be treating symptoms rather than eliminating root causes.
Create a Sourcing Loss Register
One practical approach is maintaining a centralized record of avoidable sourcing costs.
For example:
| Problem | Supplier | Annual Cost |
|---|---|---|
| Quality Rework | Factory A | $12,500 |
| Emergency Freight | Factory B | $28,000 |
| Packaging Damage | Factory C | $9,800 |
| Reinspection | Factory A | $6,200 |
| Excess MOQ Inventory | Factory D | $35,000 |
Suddenly, sourcing priorities become much clearer.
Factory D’s MOQ policy may actually represent the largest financial problem.
Rank Problems by Annual Financial Impact
Do not prioritize projects based only on frustration.
Rank them by measurable cost.
A useful framework is:
Annual Impact = Frequency × Average Financial Impact
For example:
A $500 problem occurring 40 times annually costs:
$20,000 per year
A dramatic $5,000 problem occurring once costs only:
$5,000 per year
The smaller recurring issue deserves greater attention financially.
Build a Sourcing Cost Dashboard
A management dashboard can summarize:
| KPI | Current Period | Previous Period |
|---|---|---|
| Quality Failure Cost | $18,500 | $14,200 |
| Emergency Freight | $11,000 | $7,500 |
| Reinspection Cost | $4,200 | $5,100 |
| Supplier Delays | 8 | 5 |
| Manufacturing Returns | 2.3% | 1.8% |
This immediately shows where performance is improving or deteriorating.
Separate Supplier-Caused and Buyer-Caused Problems
Data analysis should be fair.
Not every sourcing problem originates with the factory.
Delays may also result from:
- Late artwork approval
- Specification changes
- Late payments
- Forecasting errors
Assign root causes accurately.
Otherwise, the company may replace a supplier without fixing the internal process that caused the problem.
Compare Suppliers by Total Cost
Once sufficient data exists, compare factories using more than purchase price.
For example:
| Cost Category | Supplier A | Supplier B |
|---|---|---|
| Product Cost | $100,000 | $106,000 |
| Rework | $8,000 | $2,000 |
| Reinspection | $3,500 | $1,000 |
| Emergency Freight | $9,000 | $1,500 |
| Returns | $6,000 | $2,000 |
| Total | $126,500 | $112,500 |
Supplier B has the higher purchase price.
But Supplier B creates $14,000 lower total cost in this example.
This is why sourcing decisions based only on unit price can be expensive.
Turn Data Into Corrective Action
A dashboard alone does not save money.
Once the biggest problems are identified, assign:
Problem → Root Cause → Owner → Corrective Action → Deadline → Financial Target
Then measure the results.
If packaging damage costs $20,000 annually, redesigning packaging for $3,000 may create an attractive return.
Verify Whether Improvements Actually Work
After corrective action, compare the new data against the previous baseline.
For example:
Before packaging change: $18,000 annualized damage cost.
After packaging change: $5,500 annualized damage cost.
Now the sourcing team can demonstrate measurable financial improvement.
Review High-Cost Problems Regularly
Monthly or quarterly reviews can focus on the largest sourcing losses.
Ask:
- What are our five most expensive sourcing problems?
- Are they increasing or decreasing?
- What is causing them?
- Who owns the corrective action?
- What savings have been achieved?
This keeps sourcing management connected to business profitability.
How Auronix Sourcing Helps Identify Hidden Sourcing Costs
Auronix Sourcing helps businesses evaluate Chinese suppliers across more than unit price.
Support can include supplier sourcing and verification, factory audits and visits, quotation comparison, commercial negotiation, sample management, production monitoring, quality inspection, defect tracking, corrective-action follow-up, packaging optimization, supplier-performance evaluation, backup supplier development, shipment consolidation, and international shipping coordination.
By connecting supplier performance with quality, production, packaging, and logistics outcomes, Auronix helps businesses identify sourcing problems that may be increasing total landed cost even when factory pricing appears competitive.
Conclusion
Your most expensive sourcing problem may not be the one receiving the most attention.
It could be:
A recurring defect.
An unreliable production schedule.
An unnecessarily high MOQ.
Poor packaging.
Repeated emergency freight.
A supplier that looks cheap but creates expensive downstream problems.
Data makes these costs visible.
A strong process is:
Collect Data → Connect Costs → Identify Root Causes → Rank Financial Impact → Implement Corrective Action → Measure Results
The objective is not to collect more spreadsheets.
It is to discover where sourcing decisions are quietly reducing profitability.
With Auronix Sourcing, businesses can verify manufacturers, compare supplier costs, monitor production, inspect quality, optimize packaging, track supplier performance, and coordinate international shipping—helping transform sourcing data into measurable cost savings and stronger purchasing decisions.